Dmitry Sharukhin
Qualified specialist with experience in data analysis and modeling in different fields. Strong analytical skills, proficient in Excel, have Python programming experience, knowledge of pandas, sklearn, matplotlib, seaborn libraries, statistics and probability, SQL |
Have a passion to solve challenging problems using data
View My LinkedIn Profile
View My Medium Profile
BACK to homepage
Exploring Data Analyst vacancies in Russia
Tags: web scraping (selenium), EDA, data cleaning and transformation, folium
Project description: I was curious about Data Analyst vacancies placed at Russia’s biggest vacancies platform HeadHunter.ru as of end of 2022. At the same time I aimed to practice web scraping, cleaning and analysis and (possibly) to find a good job )
Data Source: https://hh.ru/
You can view full notebooks’ code here
1. Initial data scrapping (notebook)
Web scraping was performed using selenium and beautifulsoup4 packages. There were several challenges:
- how to construct URL (combining search keywords and mapping values) to get needed result
- how to split 1 search request to several smaller requests
- the structure of response (because it is contained in one very long string) and finding out necessary keys to get the data needed
First we will import all packages which will be used in parsing
import sys
from datetime import datetime as dt
from bs4 import BeautifulSoup
import json
import numpy as np
import pandas as pd
from selenium.webdriver.chrome.service import Service
from selenium.webdriver.chrome.options import Options
from selenium import webdriver
Next I had to determine how to construct search URL. By analyzing the URL structure with several requests from web page UI I found out that the URL consists of following parts:
- main part: https://hh.ru/search/vacancy?
- text to find: text=
& - where to search for text (vacancy name and/or description respectively): search_field=name&search_field=description&
- [list] of ids of area to search in (may be concatenated, all areas if omitted): area=
& - salary size and currency conditions: salary=150000¤cy_code=RUR&
- switch to leave leave only vacancies with salary in search results: only_with_salary=true&
- paging parameters: page=1&hhtmFrom=vacancy_search_list
There were some other parameters. You can see detailed description of them in notebook.
To make constructing of search URL easier the simple helper class was implemented with some initial mappings (i.e. area ids) and constants (URL fixed parts):
class HhRuUrlConstructor():
  map_search_fields = {...}
  map_areas = {...}

  def __init__(self,...) -> None:
    ...

  def _get_url_vacancy(self, vacancy_name):
    """Creates part of URL with of search name"""
    ...

  def _get_url_search_fields(self, sfields):
    """Creates part of URL with fields to search in"""
    ...

  def _get_url_areas(self, areas):
    """Creates part of URL with list of areas to search in"""
    ...

  def _get_url_salary(self, salary, currency, only_with_salary):
    """Creates part of URL with salary conditions"""
    ...

  def get_url(self, sfields=None, areas=None, salary=-1, currency=-1, only_with_salary=None, other='', page=None):
    """Combines all parts together"""
    ...
The next step was to prepare selenium for browsing:
chrome_mode = 'headed' # for debug purposes we can change this value to any but 'headless' to run Chrome in standard mode
chrome_options = Options()
if chrome_mode == 'headless':
    chrome_options.add_argument('--disable-extensions')
    chrome_options.add_argument('--disable-gpu')
    chrome_options.add_argument('--headless')
service = Service(executable_path="path\\to\\chromedriver-107-x32.exe")
browser = webdriver.Chrome(service=service, options=chrome_options)
Then I instantiated helper class, made request and parsed response using BeautifulSoup. By searching the webpage code earlier I found out that relevant information was contained under the “template” tag in json-like format
search_query = HhRuUrlConstructor(
    vacancy_name="data+scien*",
    search_fields='vac_name',
)
browser.get(search_query.get_url())
soup = BeautifulSoup(browser.page_source, 'html.parser')
json_parsed = json.loads(soup.find_all('template')[0].text)
print('"Template" tag contains {} keys'.format(len(json_parsed)))
The result contained 525 keys. It had complicated structure with multiple nested levels. After I had all the necessary information about data structure I created a function to parse pages and collect the data into one json structure and ran it
# parse all pages from first
def parse_pages(browser, search_url_obj, parse_by_underground=False, logger=logger):
    logger.debug('Flow control received')
    result = []
    browser.get(search_url_obj.get_url())
    max_available_records = 2000
    if (json_parsed['vacancySearchResult']['totalResults'] > max_available_records) and parse_by_underground:
        logger.debug('More than {} records detected => passing flow control to "parse_pages_by_undeground"'.format(max_available_records))
        result += parse_pages_by_underground(browser, first_page_url, tail_url)
    else:
        if parse_by_underground:
            logger.debug('Less than {} records detected => beginning parsing pages'.format(max_available_records))
        else:
            logger.debug('Skipping parse_pages_by_underground => beginning parsing pages')
        json_dump = json.loads(BeautifulSoup(browser.page_source, 'html.parser').find_all('template')[0].text)
        result += json_dump['vacancySearchResult']['vacancies']
        num_pages = get_num_pages(json_dump)
        logger.debug('Page 1 / {} parsed'.format(num_pages+1))
        if num_pages is not None:
            for page in range(1, num_pages+1):
                browser.get(search_url_obj.get_url(page=page))
                div_list = BeautifulSoup(browser.page_source, 'html.parser').find_all('template')
                json_dump = json.loads(div_list[0].text)
                result += json_dump['vacancySearchResult']['vacancies']
                logger.debug('Page {} / {} parsed'.format(page+1, num_pages+1))
    return result

vacancies_info = []
if len(areas_to_crawl) == 0:
    areas_to_crawl.append('1')
if len(areas_to_crawl) > 0:
    for area in areas_to_crawl:
        vacancies_info += parse_pages(browser, search_query, parse_by_underground=False)

browser.quit()
The last step included picking necessary values from collected data, transforming them into Pandas’ DataFrame and saving results
def get_record_data(rec):
    result = dict()
    result['vacancy_id'] = rec['vacancyId']
    result['vacancy_name'] = rec['name']
    result['company_name'] = rec['company']['visibleName']
    if rec['company'].get('department', np.NAN) is np.NAN:
        result['company_dept'] = np.NAN
    else:
        result['company_dept'] = rec['company']['department'].get('@name', np.NAN)
    result['area'] = rec['area']['@id']
    if rec.get('address', None) is None:
        result['address'] = np.NAN
    else:
        result['address'] = rec['address'].get('displayName', np.NAN)
        if rec['address'].get('marker', None) is None:
            result['latitude'] = np.NAN
            result['longitude'] = np.NAN
        else:
            result['latitude'] = rec['address']['marker'].get('@lat', np.NAN)
            result['longitude'] = rec['address']['marker'].get('@lng', np.NAN)
    if rec['compensation'].get('noCompensation', None) is None:
        result['salary_from'] = rec['compensation'].get('from', np.NAN)
        result['salary_to'] = rec['compensation'].get('to', np.NAN)
        result['salary_currency'] = rec['compensation'].get('currencyCode', np.NAN)
        result['salary_gross'] = rec['compensation'].get('gross', np.NAN)
    else:
        result['salary_from'] = np.NAN
        result['salary_to'] = np.NAN
        result['salary_currency'] = np.NAN
        result['salary_gross'] = np.NAN
    result['publication_time'] = rec['publicationTime']['@timestamp']
    result['last_changed'] = rec['lastChangeTime']['@timestamp']
    result['schedule'] = rec['workSchedule']
    result['req'] = rec['snippet'].get('req', np.NAN)
    result['resp'] = rec['snippet'].get('resp', np.NAN)
    result['cond'] = rec['snippet'].get('cond', np.NAN)
    result['skills'] = rec['snippet'].get('skills', np.NAN)

    return result

raw_parsed_data = {name: [] for name in df_column_names}
for rec in vacancies_info:
    parsed = get_record_data(rec)
    for key in df_column_names:
        raw_parsed_data[key].append(parsed.get(key, np.NAN))
print('Control of num of records created:', len(raw_parsed_data['vacancy_id']))
print('Vacancies ID sample: ', raw_parsed_data['vacancy_id'][:10])

# creating dataframe with collected data for further use
df = pd.DataFrame(raw_parsed_data)
df['publication_time'] = df['publication_time'].apply(pd.to_datetime, unit='s')
df['last_changed'] = df['last_changed'].apply(pd.to_datetime, unit='s')
df.set_index('vacancy_id', inplace=True)

df.to_csv('datasets/'+filename+'.csv')
2. Adding and cleaning data (notebook)
Here I added to database some useful information from pages with vacancies’ detailed description by using their ids. selenium package was used for this task again.
First I created empty columns in DataFrame
df['full_description'] = ''
df['key_skills'] = ''
df['experience_needed'] = ''
At this stage URL is much simpler - it requires only vacancy id
base_url = 'https://hh.ru/vacancy/{}'

total_num = len(df.index)
for i, vac_id in enumerate(df.index):
    logger.debug('Parsing vacancy ID {} ({} / {}) parsing'.format(vac_id, i+1, total_num))
    browser.get(base_url.format(vac_id))
    soup = BeautifulSoup(browser.page_source, 'html.parser')
    descr = soup.find_all(attrs={'data-qa': 'vacancy-description'})
    if len(descr) > 0:
        df.loc[vac_id, 'full_description'] = descr[0].text
    descr = soup.find_all(attrs={'data-qa': 'bloko-tag__text'})
    if len(descr) > 0:
        df.loc[vac_id, 'key_skills'] = ';'.join([i.text for i in descr])
    descr = soup.find_all(attrs={'data-qa': 'vacancy-experience'})
    if len(descr) > 0:
        df.loc[vac_id, 'experience_needed'] = descr[0].text

browser.quit()
And now we have additional information about each vacancy in dataset. All that left is saving data to file
df.to_csv('path/to/file.csv')
3. Salary level nalysis (notebook)
Now the database is created and saved to file and I can make some exploration of it.
Let’s import standard packages for analysis and load data from file
import numpy as np
import pandas as pd
import matplotlib.pyplot as plt
import seaborn as sns
import statsmodels.api as sm

import folium

from tqdm import tqdm

filename = 'path/to/file.csv'
df = pd.read_csv(filename, index_col=0)
df.info()
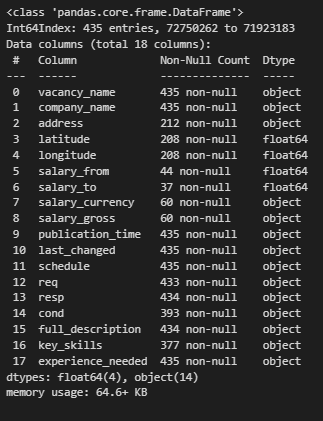
Here we can see that there are many missing values. They are mostly in salary-related and location fields. And there’s nothing I can do with them (
So let’s see if salary-related values provided contain something interesting.
The very first step in analysis is to make sure the data you’re working with is consistent and related to the same base. Okay, let’s perform some checks
# if salary levels provided are in same currency
df['salary_currency'].value_counts()
# output:
# RUR    57
# USD     3

# if all salary levels are gross
df['salary_gross'].value_counts()
# output:
# False    41
# True     19
So there are different currencies and different bases in dataset. To get comparable results I’m going to transform all currencies to RUR and subtract personal income tax (which is 13% in Russia) from gross values
rur_usd_ratio = 69.0 # exchange value
pit_ratio = 0.13 # personal income tax
df['salary_from_rur'] = df.apply(lambda x: x['salary_from'] if x['salary_currency'] == 'RUR' else x['salary_from']*rur_usd_ratio, axis=1)
df['salary_to_rur'] = df.apply(lambda x: x['salary_to'] if x['salary_currency'] == 'RUR' else x['salary_to']*rur_usd_ratio, axis=1)

df['net_income_from_rur'] = df.apply(lambda x: np.round(x['salary_from_rur']*(1-pit_ratio), 2) if x['salary_gross'] else x['salary_from_rur'], axis=1)
df['net_income_to_rur'] = df.apply(lambda x: np.round(x['salary_to_rur']*(1-pit_ratio), 2) if x['salary_gross'] else x['salary_to_rur'], axis=1)
Now columns “net_income_from_rur” and “net_income_to_rur” contain comparable values of lower and upper bound of salary level.
Let’s see what the distribution of salary is
bins = 20
fig, axs = plt.subplots(1, 2, figsize=(15, 5), sharex=True, sharey=True)
df[df['net_income_from_rur'].notna()]['net_income_from_rur'].hist(bins=bins, ax=axs[0])
axs[0].set_title('Distribution of bottom line of salaries')
axs[0].set_xlabel('Thousands RUR')
df[df['net_income_to_rur'].notna()]['net_income_to_rur'].hist(bins=bins, ax=axs[1])
axs[1].set_title('Distribution of top line of salaries')
axs[1].set_xlabel('Thousands RUR')
axs[1].set_xticks(range(0,801000,50000));
axs[1].set_xticklabels(range(0,801,50));
print('Median bottom-line level ({} / {} observations): '.format(len(df[df['net_income_from_rur'].notna()]), len(df)), np.median(df[df['net_income_from_rur'].notna()]['net_income_from_rur'].to_numpy()))
print('Median top-line level ({} / {} ) observations:   '.format(len(df[df['net_income_to_rur'].notna()]), len(df)), np.median(df[df['net_income_to_rur'].notna()]['net_income_to_rur'].to_numpy()))
Output:
Median bottom-line level (44 / 435 observations): 111550.0
Median top-line level (37 / 435 ) observations: 200100.0
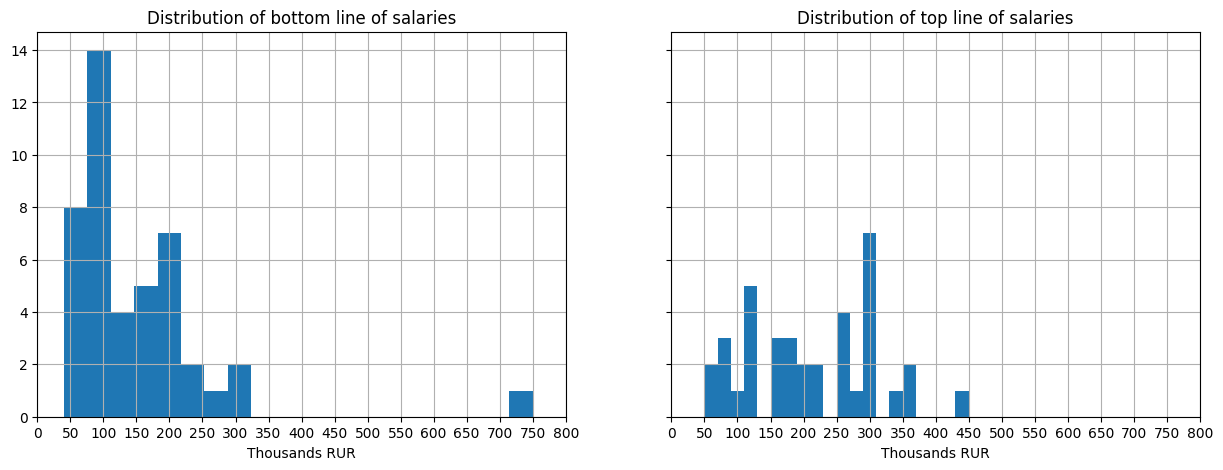
Most of salaries begin at 50’000 RUR with modal value near 110’000 RUR. There is also an outlier proposal with more than 700’000 RUR as bottom-line salary level.
The top-line levels distributed more unifofrmly mostly within 50’000-370’000 RUR range.
Now I want to see what the requirements for candidates (experience and key skills) are and if there is any difference between salary levels of different requiremens.
df['experience_needed'].value_counts()

# output:
# 1–3 года        237
# 3–6 лет         176
# более 6 лет      12
# не требуется     10
# Name: experience_needed, dtype: int64

cat_dtype = pd.CategoricalDtype(categories=['не требуется', '1–3 года', '3–6 лет', 'более 6 лет'], ordered=True)
df['experience_needed_cat'] = df['experience_needed'].astype(cat_dtype)

fig, axs = plt.subplots(1, 2, figsize=(12, 5), sharex=True, sharey=True)
sns.stripplot(data=df, x='experience_needed_cat', y='net_income_from_rur', alpha=0.5, ax=axs[0]) # used instead catplot as catplot is figure-level
sns.stripplot(data=df, x='experience_needed_cat', y='net_income_to_rur', alpha=0.5, ax=axs[1])
axs[0].set_xlabel('Experience needed')
axs[0].set_ylabel('Net salary, RUR')
axs[0].set_title('Bottom-line net salary')
mean_3_years_low = df.loc[df['experience_needed_cat'] == '1–3 года', 'net_income_from_rur'].mean()
mean_6_years_low = df.loc[df['experience_needed_cat'] == '3–6 лет', 'net_income_from_rur'].mean()
axs[0].scatter([1, 2], [mean_3_years_low, mean_6_years_low], marker='x', color='r')
axs[0].text(x=1.1, y=mean_3_years_low+2e3, s=f'{mean_3_years_low:.0f}')
axs[0].text(x=2.1, y=mean_6_years_low+2e3, s=f'{mean_6_years_low:.0f}')
mean_3_years_high = df.loc[df['experience_needed_cat'] == '1–3 года', 'net_income_to_rur'].mean()
mean_6_years_high = df.loc[df['experience_needed_cat'] == '3–6 лет', 'net_income_to_rur'].mean()
axs[1].scatter([1, 2], [mean_3_years_high, mean_6_years_high], marker='x', color='r', label='mean values')
axs[1].text(x=1.1, y=mean_3_years_high+2e3, s=f'{mean_3_years_high:.0f}')
axs[1].text(x=2.1, y=mean_6_years_high+2e3, s=f'{mean_6_years_high:.0f}')
axs[1].set_xlabel('Experience needed')
axs[1].set_title('Top-line net salary')
axs[1].legend();
Here we see that mean salary levels differ from each other. Left (“no experience”) and right (“more than 6 years experience”) categories have only one point each so I’ll ignore them but they are in line with the main visible trend.
And for 2 categories in the middle (“1-3 years” and “3-6 years”) I want to find out if this difference is statistically significant. To do this I will use 2-way independent t-test
print('p-value for H0 (mean values are equal) is ', sm.stats.ttest_ind(
    df.loc[(df['experience_needed_cat'] == '1–3 года') & df['net_income_from_rur'].notna(), 'net_income_from_rur'],
    df.loc[(df['experience_needed_cat'] == '3–6 лет') & df['net_income_from_rur'].notna(), 'net_income_from_rur']
)[1])

# Output:
# p-value for H0 (mean values are equal) is  0.00010060122947426791
Therefore the difference between salary levels of groups is statistically significant
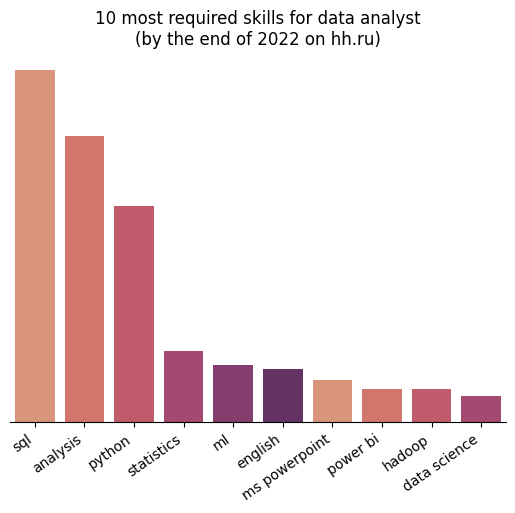
4. Required skills analysis
In this part I’m going to make a simple frequency analysis to determine what skills are most often mentioned in vacancies. To do this I have to transform the string representation of required skills to frequencies dataframe
# Splitting skills strings and calculating frequencies
key_skills_freq = {}
for skills in tqdm(df['key_skills']):
    if type(skills) == type(''):
        for skill in skills.lower().split(';'):
            if key_skills_freq.get(skill, None) is None:
                key_skills_freq[skill] = 0
            key_skills_freq[skill] += 1
df_skills = pd.DataFrame(pd.Series(key_skills_freq), columns=['frequency']).reset_index().rename(columns={'index': 'skill'})
df_skills['skill_class'] = np.nan # to mark and then group similar skills
In the resulting dataframe there are many similar skills formulated by slightly different words. So I’ll process some of most popular values to perform a frequency analysis and then look at 10 most frequent skills
import re

patterns = {
    r'sql': 'sql',
    r'статис': 'statistics',
    r'data analysis': 'analysis',
    r'анали': 'analysis',
    r'machine learning': 'ml',
    r'англ': 'english',
}

for row in df_skills.iterrows():
    for key, value in patterns.items():
        if re.search(key, row[1]['skill']):
            df_skills.loc[row[0], 'skill_class'] = value
            break
        else:
            df_skills.loc[row[0], 'skill_class'] = df_skills.loc[row[0], 'skill']

sns.barplot(data=df_skills.groupby('skill_class')['frequency'].sum().sort_values(ascending=False).nlargest(10).reset_index(), x='skill_class', y='frequency', palette=sns.color_palette("flare"))
ax = plt.gca()
ax.set_title('10 most required skills for data analyst\n(by the end of 2022 on hh.ru)')
ax.set_xticklabels(ax.get_xticklabels(), rotation=35, ha='right')
ax.set_xlabel(None)
ax.set_ylabel(None)
ax.yaxis.set_visible(False)
ax.spines[['left', 'top', 'right']].set_visible(False)
Conclusion
In this project I got dataset about Data Analyst jobs from Russian largest jobs site through web scraping technique using selenium and BeautifulSoup and made some exploratoin about salary levels and most frequent requirements for Data Analyst skills.